A world model put to the test: what holds up, measured at home
In the first part we told the theory: why LeCun is betting on world models, how the JEPA architecture works, what the LeJEPA and LeWorldModel papers promise. Here we do the other thing: we verify them. Both papers are public, with downloadable code and weights, so it can be done. We rented a GPU by the hour, took the model already trained by the authors and put it through nine experiments on two environments. Total compute spend: a few dollars. This note is the lab report: what holds up, what creaks, and where our measurement goes beyond the paper.
The testbed
Two miniature worlds. PushT, in 2D: a table seen from above, a small "hand" that pushes a T-shaped block toward a target outline. Cube, in 3D: a simulated robotic arm (MuJoCo) that moves a cube. For both there is a public checkpoint of LeWorldModel, the 15-million-parameter world model from part one: we download it and use it as is — zero training on our part, everything that follows measures the authors' model.
Working method: nothing taken on faith. Every claim of the paper that matters to us becomes a runnable experiment, with our numbers and theirs side by side. The scripts and the raw data are in our lab notebook; here we report the substance.
First question: can it use what it knows?
The ignition test. We give the model an image of the table and an image of the goal, and we ask it to actually play: at each step it imagines thousands of move sequences in its latent space, evaluates which one ends closest to the goal, executes the first move, rethinks. Fifty games, rules identical to the paper.
On PushT it wins 90% of the games (the paper: 96% over three training seeds; we measure a single seed, the public checkpoint — within statistical noise). On Cube 70% (the paper: about 74–84%, values read off a chart; and Cube is the only environment where the rival DINO-WM does better). Translation: the setup holds, the paper's numbers check out, and the model really does plan: we draw the starting points and the goals at random ourselves, so every game is a new situation.
Second question: what is written in the 192 numbers?
Every frame, for the model, is a list of 192 numbers. Question: do those numbers encode the physics of the scene, or only textures? The test is deliberately naive: it is called linear probing. Take thousands of frames, pass them through the model, and ask a regression — the simplest tool there is, chosen on purpose because it is honest: if the information is there in accessible form, a straight line will find it — to guess from the 192 numbers the block's true position, its angle, its velocity. As a control, the same regression started from raw pixels: if the latent does not beat the pixels, the model is not distilling anything.
The positions are there, and in near-perfect form: on the block's position the line reads the latent with an R² of 0.95–0.99 (a score where 1 means a perfect guess) in both worlds, better than from pixels (on Cube the depth distance, for example: 0.99 against 0.66). The paper reported the same order of magnitude: confirmed.
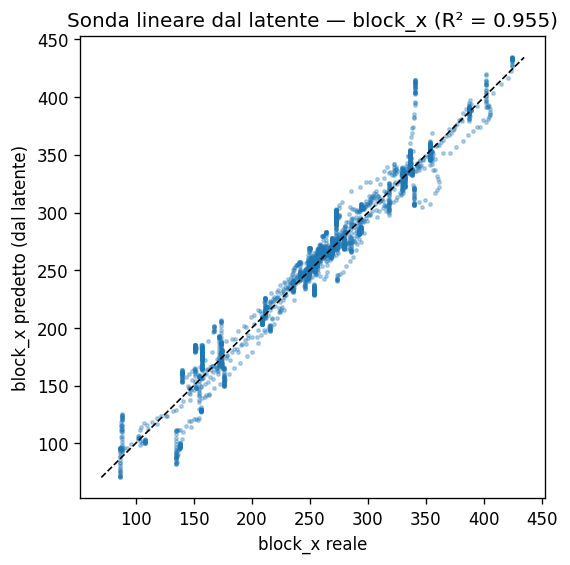
The real surprise comes with velocities: from the single frame they cannot be read, period. Not even with a more flexible regression. It is not a limit of the tool: it is a fact about the model. Because velocity is a difference of positions over time, and the model keeps it in the history, not in the frame: if you give the line the last three latent states instead of the last one, velocities become readable (R² up to 0.81). To put it in a way that is only slightly forced: the model knows where things are going, but it tells you only if you watch it move.
Third question: does it get surprised?
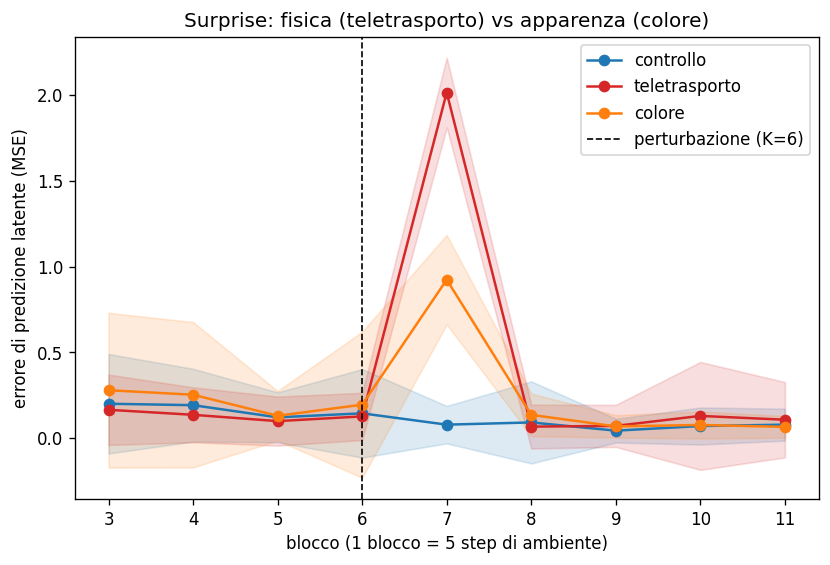
It is the test done on infants: cover a ball with a cloth and when you lift it the ball is gone — if at that point the child looks at the scene longer than usual, it means they expected something from the world (that objects do not vanish). Our equivalent: we run normal games and halfway through, poof, the block teleports to an impossible point. If the model has an expectation, its prediction must fail exactly there.
It fails exactly there. The prediction error, flat and low for the whole game, shows a sharp peak at the step after the teleport and then immediately subsides — the model absorbs the new reality. On PushT the separation between normal and rigged games is perfect (AUC 1.000 — a score where 1 means perfect separation and 0.5 guessing at random: with a threshold on the error you can build an infallible detector of impossible events). On Cube the signal is there but noisier (AUC 0.900) — and this fits with the rest of the picture: Cube is the environment where the model is weakest.
But careful: a rising prediction error could be reacting to any visual change, not only to the impossible. We need the acid test, with a group of games perturbed only in appearance: halfway through, instead of teleporting the block, we only change its color — physics unchanged, appearance upended. Result: the model notices that too (AUC 1.000), but the magnitude is precisely graded: average error 0.08 on normal games, 0.92 for the color change, 2.02 for the teleport. Surprise is neither purely physical nor purely visual: it is a mixture, and it leans the right way.
Fourth question: how long can it dream?
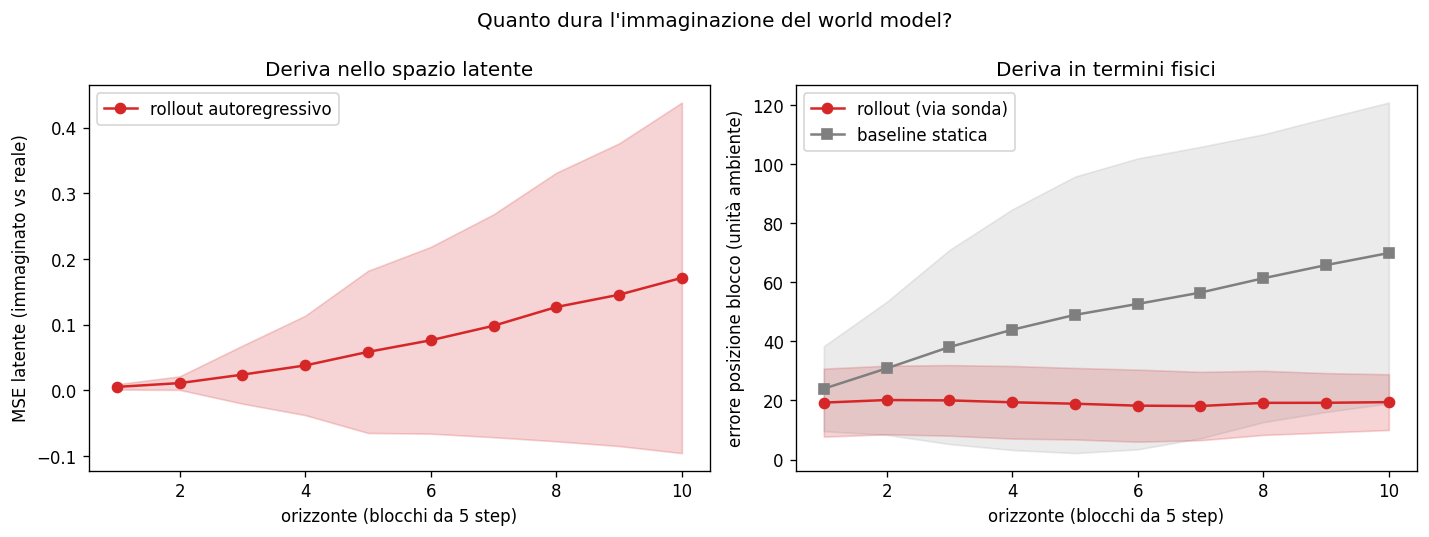
The chaos objection, from part one: the further ahead the model imagines, the more the simulation should drift away from reality. We measure it: we start from three real states and let the model dream forward for ten blocks — the model reasons in blocks of 5 steps, so fifty environment steps — in total autonomy: each prediction becomes the input of the next, without ever seeing reality. Then we compare the dream with what actually happened.
The drift is there: the distance in its latent space grows steadily, as the paper admits. But when we decode the latents into block position (with the usual probing line), the physical error stays flat over the whole horizon, while the trivial prediction "the world does not move" degrades continuously: the gap between dreaming and not dreaming widens at every step. Imagination drifts, but it stays physically coherent over the horizon needed for planning. Honesty: PushT is a heavily damped world, chaos is scarce by definition — the right measure is the gap from the baseline, not the absolute error.
What we take home
The picture that emerges is coherent, and this time we measured it directly ourselves. The world model plans (90%/70%, the paper's numbers reproduced), represents the geometry of the scene in accessible form (probing, confirmed and strengthened), gets surprised by the impossible in a graded way (our measure, cleaner than the paper's), and its imagination holds over the useful horizon (our measure, absent from the paper). The cracks exist and must be told: on Cube everything is more fragile, velocities do not live in the single frame, and even the public dataset arrives truncated — a detail you only discover if you actually try to rerun everything.
The deep objection remains, the one no experiment of this scope settles: anticipating well is not understanding. But now we know the exact point where the objection bites — dynamics, causality, out-of-distribution generalization — and we know that the tools to keep digging fit in a GPU rented for a few dollars. Which is perhaps the best news of the series: this frontier, today, can be verified from home.
Notes and references
This is the second of two parts; the first covers the theory. The verified papers: LeJEPA (Balestriero & LeCun, 2025) and LeWorldModel (Maes et al., 2026; code: le-wm, library: stable-worldmodel).
Method notes, for anyone wishing to replicate: public checkpoints quentinll/lewm-pusht and quentinll/lewm-cube on Hugging Face; planning evaluation with the same procedure as the official eval (CEM 300×30, horizon 5 blocks of 5 steps, goal at +25 steps, budget 50); Ridge probes with episode-level split; surprise test with teleport via the environment's privileged state. The cube dataset on Hugging Face is truncated (the last ~12% of rows is unreadable): our Cube results use the intact portion. The nine experiments ran on rented GPUs (RTX 4000 Ada / A4500 / A40) for a total compute cost of a few dollars.