Detecting faults without ever seeing one: a world model for predictive maintenance
Anyone who runs a plant knows the problem with predictive maintenance: to train a model to recognize faults you need examples of faults — and faults, luckily, are rare. In this note we close the circle of the world model series (the theory, the test of someone else's model): we trained our own world model on a simulated plant, using only footage of normal operation, and used its "surprise" as a fault detector. Without a single fault example in training.
The toy plant
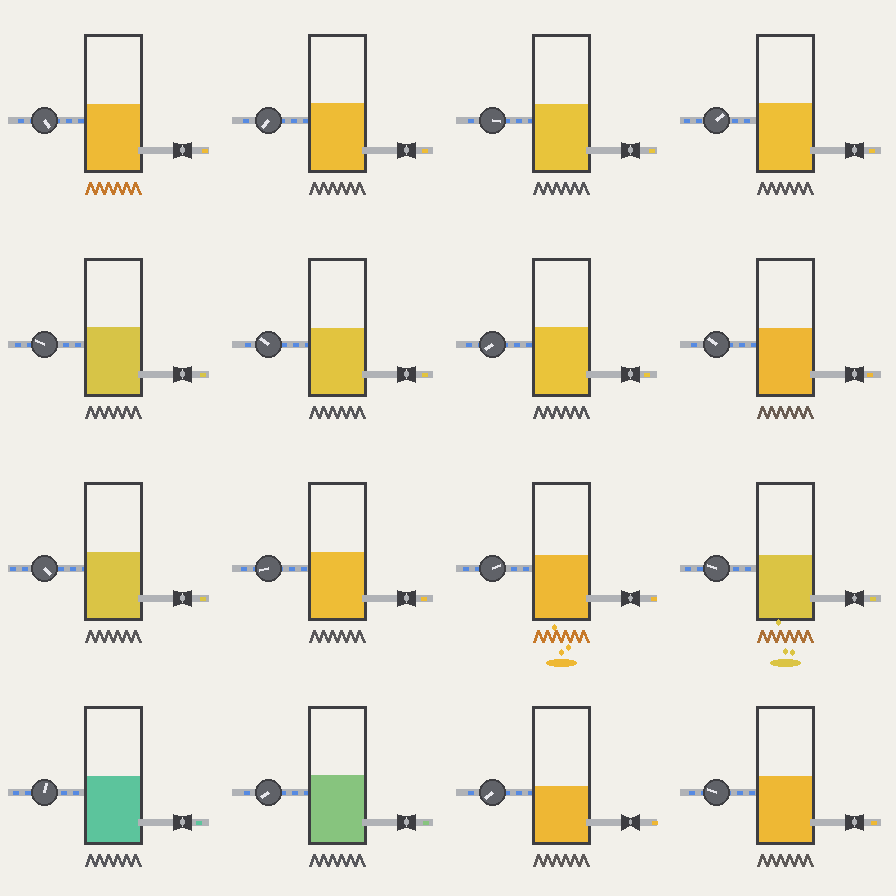
The bench is a miniature thermal plant we built on purpose: a water tank (the level is visible, the temperature is read from the color), a heating element, an inlet pump, an outlet valve. A simple regulator holds the temperature at 60 °C and the level at halfway: no learning, no rewards — the simulated counterpart of how a real plant runs under normal operation.
Four injectable faults, chosen to cover different signatures: the pump slowly degrading (ten blocks to go from healthy to one third of its flow rate), the heater failing abruptly, a leak in the tank, the valve getting stuck. Each has a different physical consequence: thermal, hydraulic, slow, sudden.
Training: normal operation only
We recorded 800 episodes of normal operation (frames plus the regulator's actions, no labels, no faults) and trained LeWorldModel from scratch, with the paper's recipe unchanged: three hours on a rented GPU, cost about one dollar. The model learns to answer a single question: "what happens at the next instant, given the situation and what the regulator is doing?". Of faults it has never seen a trace.
The demo: the model detects the fault before the alarm
The video shows a real evaluation episode: halfway through, the heater fails. The red curve is the model's prediction error — its surprise. It spikes at block 31, one step after the fault; the process alarm (temperature out of tolerance) fires only at block 42, when the water is already cold. The lead time is 11 blocks.
All the numbers
The full evaluation: 200 episodes, 40 per class (normal plus the four faults), fault injected halfway through the episode. The separation between faulty and normal episodes, measured with AUC (1 = perfect, 0.5 = guessing at random): 0.98 for the degrading pump, 0.99 for the leak, 0.88 for the heater, 0.71 for the stuck valve — the weakest fault, as expected: a valve that freezes near its normal position changes the dynamics very little.
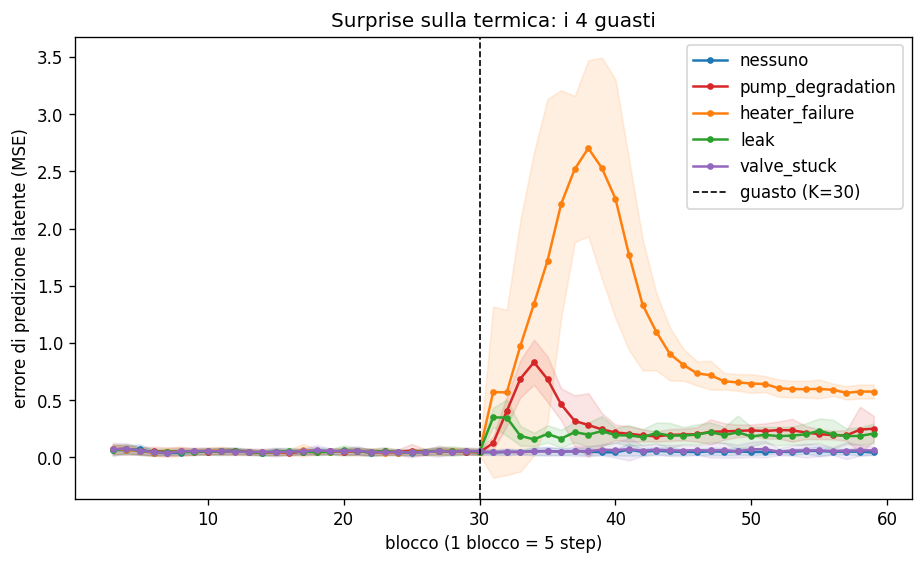
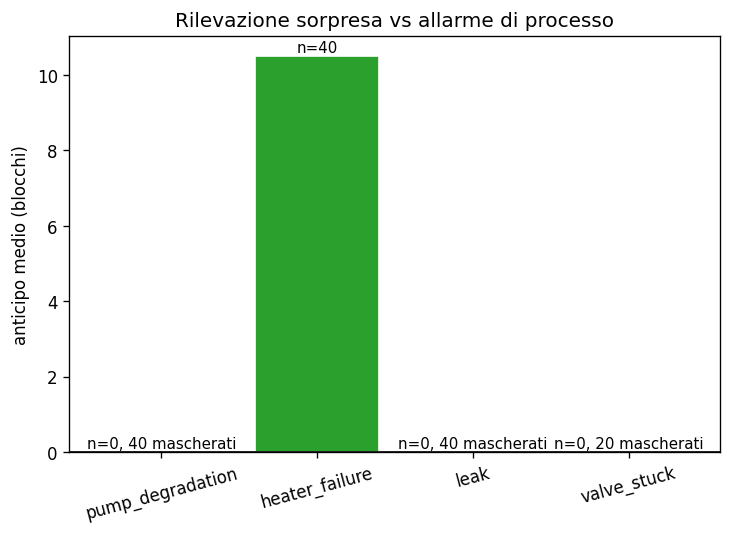
Then the finding we had not foreseen. For pump and leak, surprise detects the fault in all 40 episodes — and the process alarm fires never: the regulator compensates for the fault and temperature and level stay in band. The control system masks the problem as long as it can; the world model sees it anyway, because it does not watch the controlled variables: it watches the dynamics, and those have changed. For predictive maintenance this is the most valuable case — in a real plant a fault like this is discovered when everything breaks, weeks later.
Does it hold up to a second run?
A single training run can be lucky. So we redid everything from scratch: another seed, another regenerated dataset, another model (this time stopped after a few epochs, when the loss had settled). The key numbers come back: same AUCs one decimal digit away, lead time on the heater 10.5 blocks against 11.3 of the first training, same masked faults detected. The pipeline — simulation, training, detection — can be rebuilt in an afternoon.
And not just detection: diagnosis
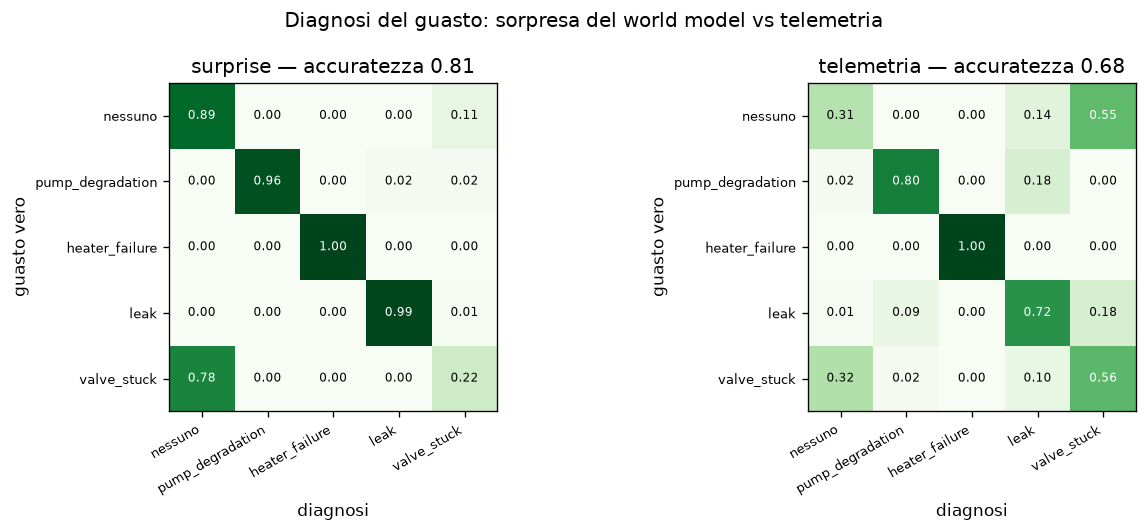
One question remains: surprise tells you that something has changed — but does it also say what has changed? The signatures in the error curve are visually distinct, so we put a classifier on top: multinomial logistic regression (the simplest possible tool, in line with the philosophy of the rest of the work) on the 15 blocks of curve after the fault, a thousand episodes, train and test on different seeds. As a comparison, the same classifier on the temperature and level trajectories — what classic process monitoring would see.
Result: surprise diagnoses correctly in 81% of cases, telemetry in 68%. The gap is where we expected it. On the faults masked by the regulator, telemetry struggles: degrading pump 0.96 against 0.80, leak 0.99 against 0.72. And on normal episodes telemetry cries wolf: it mistakes healthy operation for a fault 69% of the time (confusing it mostly with the stuck valve), while surprise stays at 0.89. A shared weak point, the stuck valve: almost invisible to both, because it changes the dynamics too little — honesty demands we say this too.
In one sentence: with a model trained only on normal operation you get detection, advance warning, and a first-approximation diagnosis — all things a real plant lacks exactly where faults have no examples.
What someone with a real plant takes home
The limits first of all: our world is a two-dimensional simulation with two variables, and the leap to real sensors and machines is all to be proven; surprise says that something has changed, not which fault it is (diagnosis is the next step); and a fault that changes the dynamics little, like the stuck valve, remains almost invisible.
That said, the transferable points are concrete. The model trains on normal-operation data alone — the data every company already collects. No rewards or labels needed: observations and actions are enough. The compute cost is negligible (one dollar, here). And the signal that comes out is of the kind process alarms lack: it detects the change in dynamics even when the control is masking it. The road to a real plant goes through there: a few cameras or a few rendered time series, and the same recipe.
Notes and references
This is the third part of a series: the theory and the test of someone else's model in the previous parts. The model is LeWorldModel (Maes et al., 2026), built on LeJEPA (Balestriero & LeCun, 2025); training with the public code le-wm on stable-worldmodel.
Method notes: our own simulation (Euler, thermostat with hysteresis at 60 °C, proportional level control at 0.5); 800 training episodes of 300 steps, frameskip 5 as in the original; block actions of 15 dimensions standardized on the training set; surprise = quadratic error between the predicted latent (history of 3 blocks + actions) and the latent of the next real frame; detection threshold = mean + 3σ of the errors on normal episodes; process alarm band: temperature outside 50-70 °C or level outside 0.35-0.65. Both trainings were stopped at flat loss (pred_loss ~0.03), the first after 10 epochs, the replica after 3.