A world model for a real valve: faults detected in five seconds without ever seeing one
In the previous part the bench was a simulated miniature thermal plant: convenient, controllable, but still a model of the world rather than the world itself. The real question stayed open: does the recipe hold on real data? This note is the answer. We took one of the classic benchmarks of industrial fault detection — the telemetry of a pneumatic valve in a Polish sugar factory, recorded in 2001 — and applied the same procedure, almost unchanged. The verdict up front: on the faults the dashboard makes visible, the model detects them within five seconds of onset, without ever seeing one in training.
The bench: a real valve
The benchmark is called DAMADICS and it was created to compare diagnosis methods on industrial actuators. The data is real telemetry: three pneumatic valves of the Lublin sugar factory, observed for 25 days in November 2001, one sample per second per quantity. For the flow valve we chose (code FC57_03) that makes over two million samples for each of the six quantities: controller output, stem position, flow rate, upstream and downstream pressure, temperature.
In the middle of normal operation, the benchmark documents 19 fault episodes of four types: air supply failure, upstream pressure surge, open bypass, faulty flow sensor. They are short faults — fourteen seconds to a few minutes — injected on purpose by the authors, with onset and end certified to the second. For us they are gold: a ground truth against which to measure detections and delays, something we had to hand-build in the simulation.
From telemetry to dashboard
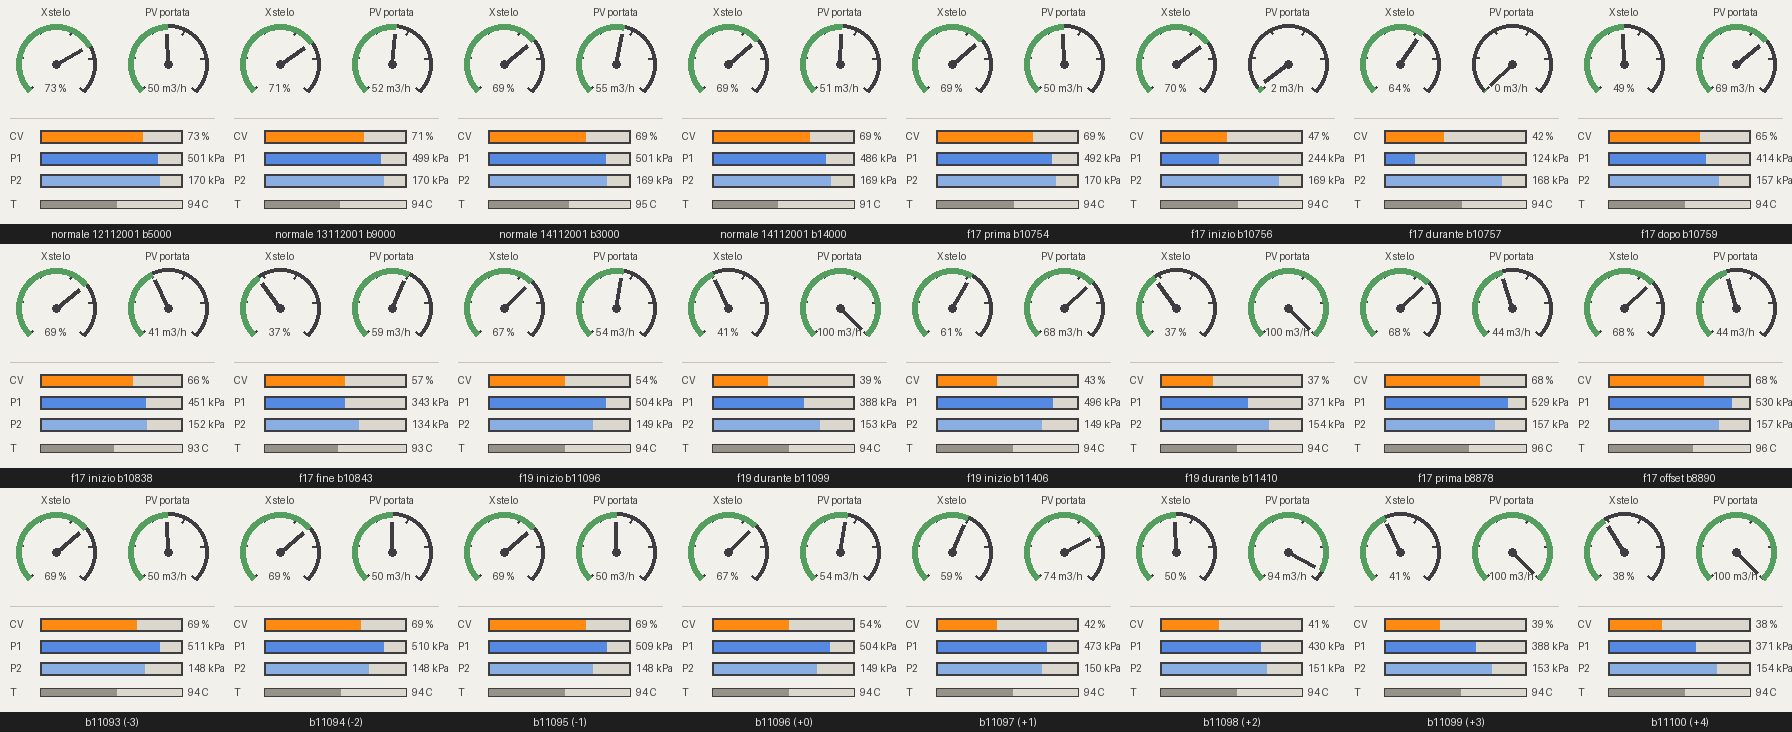
LeWorldModel speaks in images; a valve speaks in time series. The bridge is turning telemetry into an image: every five-second block becomes a 224×224 instrument panel — two needle gauges for stem position and flow rate, horizontal bars for the controller output and the two pressures, a thin indicator for temperature. The action the model receives at each step is the five controller-output values of the block. Honesty constraint: only quantities that real sensors actually measure enter the dashboard; fault labels stay out, in the metadata used only for evaluation.
Training: normal operation only
From the 25 days we kept only the healthy periods: 81 episodes of normal operation, 423,567 five-second blocks. Training from scratch with the unchanged recipe, eight epochs on a rented GPU, stopped when the loss flattened out. Faults, once again, the model never saw: it only learned to predict the next block of telemetry given the recent history and what the controller is doing.
The numbers
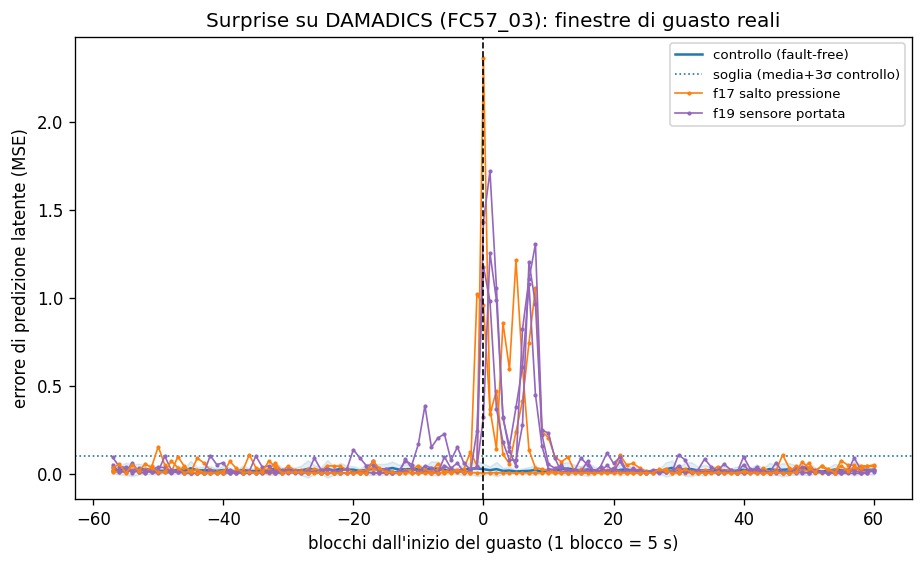
The evaluation pits the six recorded windows around the valve's faults — five minutes before and five after the certified onset — against thirty control windows drawn from healthy periods. The alarm threshold is the usual rule: mean plus three standard deviations of the errors on normal operation.
On the flow-sensor fault the answer is clear-cut: AUC 1.000, three windows out of three detected, and the surprise crosses the threshold already on the first block after onset — five seconds. The error shoots to a hundred times the baseline and settles back within twenty blocks, tracking the real duration of the fault. On the pressure surge, the shortest fault (fourteen to twenty-two seconds), two windows out of three: the missed one is the shortest of all and leaves too weak a signature on the dashboard — the error stays below half the threshold. To be fair: the twenty-year literature on this benchmark works with dedicated methods, supervised or statistical, trained on fault examples too; our model has seen zero, and it recognizes five windows out of six immediately.
The demo: the sensor node live
The best way to judge is to watch it work. The interactive demo replays two real hours of November 17, 2001 — the ones with five faults — as a live stream: the dashboard the model sees (the original frames, not a reconstruction), the surprise curve with its threshold, the alarm going off. At real speed it lasts two hours like reality; at 240× you can watch it in thirty seconds. It is the dress rehearsal of what a sensor node attached to the valve would do: no cloud, no labels, just the model being surprised.
What is missing
Three declared limits. First: one actuator out of three and two fault types out of four in evaluation — the other valves and the other faults await their training. Second: the short pressure surge remains the weak spot; the way to strengthen it goes through a finer time resolution or instruments more sensitive to pressure. Third: the figure that decides everything — how much hardware it takes to run the model attached to the valve — is so far a back-of-envelope estimate (three milliseconds per block on GPU, about fifty on a laptop CPU, against the five seconds of the block) and must be measured on real constrained hardware. That is the next experiment of this research line.
The direction, though, is the right one: the same recipe that worked in the simulated plant holds on real telemetry, with numbers a maintenance engineer can use. A small world model, trained only on normal operation, can sit next to a component and stand guard. What remains is measuring how small the hardware hosting it can become.
Notes and references
This is the fourth part of a series: the theory, the test of someone else's model, the simulated plant in the previous parts. The model is LeWorldModel (Maes et al., 2026), built on LeJEPA (Balestriero & LeCun, 2025); training with the public le-wm code on stable-worldmodel. The data is the DAMADICS benchmark (Bartyś & Syfert, "DAMADICS Benchmark Definition", 2002), recorded at the Lublin sugar factory.
Method notes: 5-second block (5 samples at 1 Hz); the frame is the dashboard of the block means; action = the 5 controller-output values, standardized on the training set; surprise = squared error between the predicted latent (3-block history + actions) and the latent of the next real frame; threshold = mean + 3σ over 30 fault-free control windows, estimated on steady-state blocks; latency = first block after fault onset with error above threshold, in 5-second blocks; validation loss at the end of training 0.024, flat for three epochs.